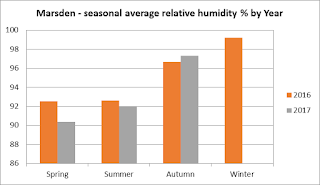
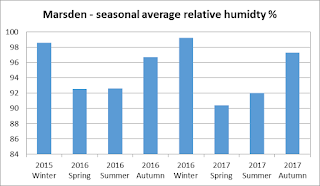
A new week and a new site - let's take a look up north at Marsden. The following graphs show how the relative humidity (level of moisture in the air) changes at this site month to month and across the seasons.
Thanks again to Andy Burn for the graphs and to all our Marsden volunteers who collected the data!
Showing posts with label change. Show all posts
Showing posts with label change. Show all posts
Tuesday, 27 November 2018
Thursday, 15 November 2018
Environmental monitoring results: Burbage water table
In our last post we looked at the temperature changes on Burbage. Another variable that our volunteers measure monthly is water table depth. This is done both manually and with an automatic data-logger. The following graphs show how the average water table depth has changed since 2015.
Thanks again to Andy Burn for producing these graphs and to all the volunteers who have been out on the moors collecting this data!
Thanks again to Andy Burn for producing these graphs and to all the volunteers who have been out on the moors collecting this data!
Tuesday, 16 October 2018
Environmental monitoring results: Holme water table
In our last couple of posts we looked at the temperature and humidity changes at Holme Moss. The last set of data for this site is the water table depth - how far below the surface of the ground the water table is. In a healthy bog, the closer to the surface the better!
Thanks again to Andy for producing these graphs which show the changes monthly and seasonally for 2016 and 2017.
Thanks again to Andy for producing these graphs which show the changes monthly and seasonally for 2016 and 2017.
Wednesday, 13 December 2017
A volunteer celebration walk
Dec 8th 2017 saw our hardy volunteers wrap up for a celebratory walk on to Kinder Scout.
What were we celebrating? Well, not just that Christmas is coming. This social event allowed us to salute Community Science's brilliant volunteers for all their fantastic efforts through the year, and also to thank them for helping the project to win this year's prestigious 'Park protector Award' - awarded by the Campaign for National Parks.
Volunteers were joined by Peak District National Park CEO Sarah Fowler, and Head of Programme Delivery at Moors for the Future Partnership - Chris Dean - who was also celebrating 15 years at the Partnership.
At the plateau, Phil from the Partnership's Conservation and Land Management team talked about some of the wider conservation work that has been happening in the area, but the -14C windchill meant the stop was short and sweet! 2017 has been a great year for the project, and the snowy views and mince pies were a perfect way to round it off.
Wednesday, 28 June 2017
Community Science wildlife records 2016 - an overview
During 2016, Community Science received sightings of 6324 individual animals via our 'casual record' surveys; that is: birds (curlew, red grouse and swallow); butterflies (peacock, orange tip and green hairstreak); mountain hares, brown hares and rabbits; and ring ouzel and redwing.
The majority of sightings - 4322 - were from the birds survey, but 300 butterflies were seen along with 893 hares and rabbits, and 809 ring ouzels or redwings.
The map below shows the distribution of these records across our project area
- the Peak District and South Pennines. The blue line is the boundary
of the Peak District National Park, and the purple shape is the SAC
(Special Area of Conservation) designated as internationally important
for the habitats it contains - including blanket bog.
The light blue dots show where sightings of these individual animals came from (note that each dot could represent more than one individual animal, for example if someone saw 10 swallows in a particular place) and it is interesting to note that generally, the sightings broadly match the SAC shape, especially in the Dark Peak area.
The red dots, added for comparison, show where we distributed freepost postcards asking for people to send in sightings (sightings were also submitted via our website and the MoorWILD app). These hint at the correlation between location of sightings and distribution of postcards - underlining the limits of 'casual' surveys such as these.
Nevertheless, there are some useful and interesting things which the data can reveal: During 2016 the casual ring ouzel sightings helped to inform where surveyors looked when conducting an extensive breeding bird survey of the Eastern Moors area. The distribution of hares, and the correlation between mountain hare coat colour and snowfall has fed into a PhD on the subject of 'seasonal crypsis' in that species.
In the longer term, we'll be able to see if the dates certain species are first sighted in a year (for example emergence of green hairstreak butterfly, or the return of curlews to their moorland breeding areas) are shifting - and whether this fits into a pattern of earlier springs which are predicted to occur as our climate changes.
To find out more about current climate change research, please see some of the links we've gathered together on our webpage.
Subscribe to:
Posts (Atom)


