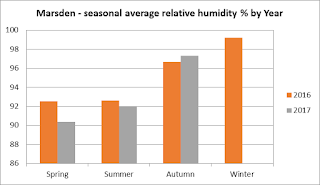
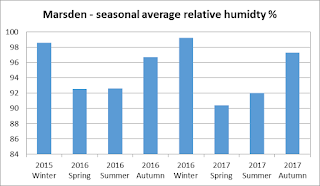
A new week and a new site - let's take a look up north at Marsden. The following graphs show how the relative humidity (level of moisture in the air) changes at this site month to month and across the seasons.
Thanks again to Andy Burn for the graphs and to all our Marsden volunteers who collected the data!


No comments:
Post a Comment