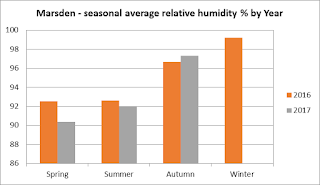
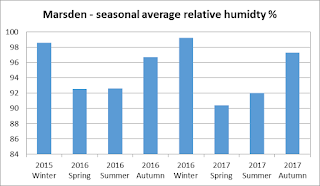
A new week and a new site - let's take a look up north at Marsden. The following graphs show how the relative humidity (level of moisture in the air) changes at this site month to month and across the seasons.
Thanks again to Andy Burn for the graphs and to all our Marsden volunteers who collected the data!
Tuesday, 27 November 2018
Thursday, 15 November 2018
Environmental monitoring results: Burbage water table
In our last post we looked at the temperature changes on Burbage. Another variable that our volunteers measure monthly is water table depth. This is done both manually and with an automatic data-logger. The following graphs show how the average water table depth has changed since 2015.
Thanks again to Andy Burn for producing these graphs and to all the volunteers who have been out on the moors collecting this data!
Thanks again to Andy Burn for producing these graphs and to all the volunteers who have been out on the moors collecting this data!
Tuesday, 30 October 2018
Environmental monitoring results: Burbage temperature
Another one of our monitoring sites is Burbage. Volunteers have collected environmental monitoring data here since 2015. As the frosty season starts, let's look at the monthly and seasonal temperatures and see how they have varied over the past couple of years.
Thanks to Andy Burn for producing these graphs, and thanks to our volunteers for getting out in all weather!
Thanks to Andy Burn for producing these graphs, and thanks to our volunteers for getting out in all weather!
Thursday, 25 October 2018
Environmental monitoring results: Chatsworth data
One of our newest environmental monitoring sites is Chatsworth. Set up last year, our volunteers have been collecting temperature, humidity, and water table depth data. As it's too soon to compare yearly or seasonal data, let's have a look at these three variables together.
Thanks again to Andy Burn for producing these graphs. We look forward to seeing how this year's data compares.
Thanks again to Andy Burn for producing these graphs. We look forward to seeing how this year's data compares.
Tuesday, 16 October 2018
Environmental monitoring results: Holme water table
In our last couple of posts we looked at the temperature and humidity changes at Holme Moss. The last set of data for this site is the water table depth - how far below the surface of the ground the water table is. In a healthy bog, the closer to the surface the better!
Thanks again to Andy for producing these graphs which show the changes monthly and seasonally for 2016 and 2017.
Thanks again to Andy for producing these graphs which show the changes monthly and seasonally for 2016 and 2017.
Tuesday, 9 October 2018
Environmental monitoring results: Holme humidity
In our last post we showed the temperature variation at Holme Moss and how this changes monthly and across the seasons. Another variable that our volunteers measure on site is the relative humidity (level of moisture in the air). The following graphs show how this varies monthly, yearly, and seasonally.
Special thanks to Andy Burn for producing these graphs.
Special thanks to Andy Burn for producing these graphs.
Tuesday, 2 October 2018
Environmental monitoring results: Holme temperature
As the temperature starts to drop outside this week, let's have a look at the temperature results from Holme Moss. This environmental monitoring site is situated at about 540m above sea level.
Thanks again to Andy Burn for producing these graphs which show the monthly and seasonal average (mean) air temperatures collected over the last three years by our volunteers.
Thanks again to Andy Burn for producing these graphs which show the monthly and seasonal average (mean) air temperatures collected over the last three years by our volunteers.
Subscribe to:
Comments (Atom)


